International Fluid Power Inc.
International Fluid Power - Innovative Partners For Global Sourcing Of Fluid Power Products. Your Complete Hydraulic Source in SE Minnesota.
Carbon fiber is no longer a niche material reserved for aircraft laboratories. It now supports wind-turbine blades, pressure vessels, electric vehicles, sporting goods, and advanced infrastructure.
MarketsandMarkets estimates the global carbon fiber market could grow from approximately US$4.7 billion in 2024 to US$7.8 billion by 2029. Its report identifies aerospace, renewable energy, and automotive applications as major growth drivers. The International Energy Agency also reports continuing expansion in electric mobility and wind power, where lightweight composite structures can improve efficiency. However, market forecasts differ. Definitions, regional coverage, and recycling assumptions are not always consistent.
This ranking examines the Top 10 Carbon Fiber Production Line Factories Worldwide through a practical manufacturing lens. We consider precursor integration, carbonization capacity, surface treatment, quality control, automation, energy management, and customer certification. A strong Carbon fiber production line factory must deliver stable tow quality, not merely impressive annual capacity. Small process variations can affect tensile strength, modulus, and final part performance.
Dr. Stephen W. Tsai, a respected composites researcher, has emphasized: “A composite is a process, not just a material.” That principle remains highly relevant. Equipment layout matters. Furnace temperature uniformity matters. So does operator experience.
The list is not perfect. Public capacity data can be incomplete, and some factories disclose little about actual utilization. Therefore, readers should treat this overview as a structured industry guide, not an absolute verdict. Performance claims deserve independent verification.
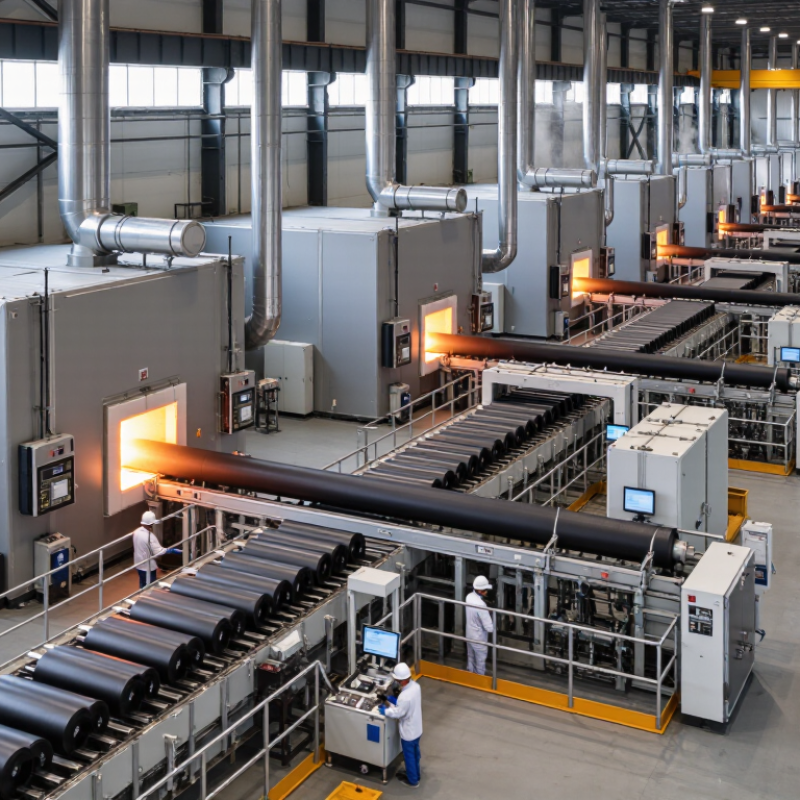
Carbon fiber production begins with a controlled precursor, usually polyacrylonitrile, or PAN. Manufacturers spin PAN into stable filaments before oxidation, carbonization, and surface treatment. Each stage changes the fiber’s strength, conductivity, and handling behavior. A modern production line may run thousands of filaments through heated ovens, where temperature uniformity matters within narrow limits.
Industry data shows why capacity comparisons need caution. CompositesWorld’s 2024 annual capacity review estimated global carbon fiber nameplate capacity at roughly 200,000 metric tons per year. However, nameplate output is not actual output. Maintenance, energy costs, qualification delays, and rejected tow can reduce usable supply. That distinction is often overlooked.
Quality control combines process records with physical testing. ASTM D4018 covers tensile properties of carbon fiber, while ISO 11566 addresses single-filament tensile testing. Producers also monitor tow spread, sizing content, filament breaks, and moisture. A small variation in sizing can affect resin wet-out later. In practice, factory engineers inspect fiber under magnification and test resin compatibility before shipment. The International Energy Agency reports that industrial energy efficiency remains central to lowering manufacturing emissions, and carbonization ovens are major energy users. Better insulation helps, but it is not a complete solution. Some production lines still depend on inconsistent recycled feedstocks, making quality claims difficult to compare. That is where factory audits, batch traceability, and independent laboratory results become essential.
Carbon fiber production commonly includes precursor preparation, stabilization, carbonization, optional graphitization, surface treatment, and sizing. The chart shows representative industrial temperature ranges for key production stages; actual settings vary by precursor type, tow size, furnace design, and target fiber grade.
Quality control is typically supported by standards such as ASTM D4018 for tensile properties of carbon and graphite fiber and ISO 11566 for tensile testing of single-filament carbon fiber specimens. Key production checks include tensile strength, tensile modulus, elongation, filament count, sizing content, surface chemistry, and tow uniformity.
A modern carbon fiber production line begins with polyacrylonitrile, or PAN, precursor. Rolls unwind continuously while tension systems prevent wrinkles and uneven stretching. Controlled stretching improves molecular orientation. Then, stabilization ovens heat the fibers in air, usually between 200°C and 300°C. This slow oxidation step changes the polymer structure and prevents melting during later heating.
Carbonization follows inside oxygen-free furnaces operating around 1,000°C to 1,500°C. Volatile elements leave the fiber as process gases, while carbon-rich filaments remain. High-modulus grades may enter graphitization zones above 2,000°C. Very hot, indeed.
Furnace speed, gas flow, and line tension must stay remarkably stable. A small tension drift can create weak spots across thousands of filaments.
After carbonization, the line applies electrochemical surface treatment to improve resin bonding. A thin sizing layer follows, then drying and precision winding produce the finished tow. Inline cameras, tensile testing, and laboratory checks verify filament diameter, strength, modulus, and sizing content. MarketsandMarkets’ 2024 Carbon Fiber Market report projects growth from about 4.7 billion dollars in 2024 to 7.3 billion dollars by 2029, raising pressure for higher throughput and lower energy use. Yet production data are not perfectly comparable. Furnace design, precursor quality, and testing methods can change reported performance, so factory claims deserve careful verification.
Leading carbon fiber production factories depend on tightly controlled thermal chemistry. Most begin with polyacrylonitrile precursor fibers, then stretch and oxidize them in air. Stabilization commonly occurs near 200–300°C. Carbonization follows in oxygen-free furnaces, often between 1,000°C and 2,000°C. Higher temperatures improve modulus but increase energy demand. Small tension changes can affect the final fiber diameter and strength.
The technology is precise, but not flawless. Industrial lines use infrared sensors, furnace atmosphere controls, and continuous tension monitoring. Surface treatment improves bonding with resin, while sizing protects filaments during weaving and handling. According to CompositesWorld’s 2024 industry capacity survey, announced global carbon fiber capacity exceeds 200,000 metric tonnes annually. That figure includes planned facilities, not guaranteed output. This distinction matters.
Energy efficiency is becoming a competitive requirement. The U.S. Department of Energy’s Industrial Decarbonization Roadmap identifies process heat and electricity as major manufacturing emission sources. Leading factories therefore recover furnace heat, optimize gas circulation, and reduce startup losses. Automated inspection systems can detect broken filaments before entire production batches fail. Useful, but imperfect. Recycled carbon fiber also receives attention, although recovered fibers may lose length, alignment, or surface performance. A reliable factory must measure those compromises, not hide them.
Top 10 Carbon Fiber Production Line Factories Worldwide
Global carbon fiber production is concentrated across East Asia, North America, and Europe. East Asia remains the strongest manufacturing center, supported by mature precursor supply, skilled process engineers, and large-scale conversion lines. Industry forecasts from MarketsandMarkets estimate the global carbon fiber market could grow from about USD 4.6 billion in 2024 to USD 6.8 billion by 2029. That growth will not be evenly distributed.
East Asian factories generally emphasize high-volume standard-modulus fiber for wind energy, pressure vessels, automotive parts, and industrial equipment. North American production lines show stronger links with aerospace qualification, defense-related engineering, and advanced transportation systems. European factories focus heavily on automotive lightweighting, renewable energy components, and recyclable composite development. The regional map is clear, but not perfectly clean. Many facilities serve several industries at once.
Production strength also depends on fiber grade, tow size, precursor integration, and quality certification. Lucintel’s 2024 carbon fiber market analysis identifies aerospace, wind energy, and automotive applications as major demand drivers. Aerospace lines usually require tighter statistical control and longer approval cycles. Wind-energy lines prioritize scale and stable pricing. Automotive lines need repeatability at faster cycle rates. These demands create different factory advantages. A large plant is not automatically a better plant. This point is often missed. Future rankings should measure usable capacity, energy intensity, local supply chains, and qualification depth, rather than counting production lines alone.
| Rank | Production-Plant Location | Industrial Region | Primary Precursor | Main Carbon-Fiber Grade | Indicative Installed Capacity | Typical Filament Tow | Key Process Strength | Major End-Use Sectors | Industrial Advantage |
|---|---|---|---|---|---|---|---|---|---|
| 1 | Japan | East Asia | PAN-based precursor | Aerospace-grade and industrial-grade carbon fiber | Multi-thousand tonnes per year | Large-tow and standard-tow lines | Highly integrated stabilization, carbonization, surface treatment and sizing | Aerospace, pressure vessels, wind energy, automotive and sporting goods | Long-established process engineering, quality control and export infrastructure |
| 2 | United States | North America | PAN-based precursor | Industrial, aerospace and high-strength grades | Multi-thousand tonnes per year | Standard-tow and intermediate-tow lines | High-performance fiber development and qualification for regulated applications | Aerospace, defense, civil infrastructure, automotive and energy | Strong research ecosystem, advanced composites demand and domestic aerospace market |
| 3 | China | East Asia | PAN-based precursor | Industrial-grade, high-strength and large-tow fiber | Multi-thousand tonnes per year | Large-tow, intermediate-tow and standard-tow lines | Rapid capacity expansion with vertically coordinated precursor and fiber production | Wind-turbine blades, pressure vessels, transportation, infrastructure and aerospace | Large domestic market, expanding supply chain and competitive manufacturing scale |
| 4 | Germany | Western Europe | PAN-based precursor | Industrial-grade and high-modulus specialty fiber | Hundreds to several thousand tonnes per year | Standard-tow and intermediate-tow lines | Precision process control, automated handling and specialty-grade development | Automotive, aerospace, industrial machinery and renewable energy | Strong engineering base, advanced automation and proximity to European composite users |
| 5 | South Korea | East Asia | PAN-based precursor | High-strength and industrial-grade carbon fiber | Hundreds to several thousand tonnes per year | Standard-tow and intermediate-tow lines | Integrated precursor production and efficient continuous carbonization | Hydrogen storage, pressure vessels, wind energy, automotive and electronics | Strong chemical industry, export orientation and growing hydrogen economy |
| 6 | Taiwan | East Asia | PAN-based precursor | Industrial-grade and high-strength carbon fiber | Hundreds to several thousand tonnes per year | Standard-tow and intermediate-tow lines | Stable continuous production, textile integration and application-specific sizing | Sporting goods, bicycles, electronics, automotive and industrial composites | Efficient export logistics and close links with composite-product manufacturers |
| 7 | Hungary | Central Europe | PAN-based precursor | Aerospace-grade and industrial-grade carbon fiber | Hundreds to several thousand tonnes per year | Standard-tow and intermediate-tow lines | High-quality continuous processing with strong European qualification capability | Aerospace, automotive, sporting goods and industrial components | Central European location, skilled technical workforce and regional supply-chain access |
| 8 | Mexico | North America | PAN-based precursor | Industrial-grade carbon fiber and composite reinforcement | Hundreds to approximately one thousand tonnes per year | Standard-tow and intermediate-tow lines | Regional conversion, finishing and integration with composite manufacturing | Automotive, aerospace components, construction and sporting goods | Nearshoring advantages and access to North American manufacturing networks |
| 9 | Türkiye | Europe–West Asia | PAN-based precursor | Industrial-grade and defense-oriented carbon fiber | Hundreds to approximately one thousand tonnes per year | Standard-tow and intermediate-tow lines | Domestic precursor development and flexible industrial-grade production | Defense, aerospace, automotive, pressure vessels and infrastructure | Regional market access and increasing local capability in advanced composites |
| 10 | Portugal | Southern Europe | PAN-based precursor | Industrial-grade and specialty carbon fiber | Pilot-to-commercial scale, generally below major Asian clusters | Standard-tow and specialty-tow lines | Flexible production, process development and collaboration with composite manufacturers | Renewable energy, mobility, construction and industrial components | European research links, renewable-energy demand and adaptable manufacturing footprint |
Comparing the world’s leading carbon fiber production lines requires more than checking annual capacity. A reliable assessment begins with precursor quality, stabilization control, carbonization temperature, and fiber tension. These factors influence tensile strength, modulus, surface finish, and batch consistency. Numbers can mislead.
During factory evaluations, inspect the entire process rather than one impressive machine. Measure line speed, temperature stability, energy use, emissions control, and downtime records. Ask for traceability data covering raw materials, maintenance, testing, and rejected rolls. Independent laboratory results are more credible than promotional specifications. Small details matter. A clean layout, calibrated sensors, and trained operators often reveal production discipline.
Tips: Compare factories using the same fiber grade and test standard. Check whether capacity figures represent theoretical output or verified production. Review samples from different months, not only one successful batch. Also examine waste rates and repair response times. These practical indicators can expose weaknesses hidden behind modern equipment. No production line is perfect; even experienced teams may struggle with tension changes during startup or seasonal humidity shifts. A fair ranking should acknowledge these limits and explain how each factory manages them.
This is an example of a widget area that you can place text to describe a product or service. You can also use other WordPress widgets such as recent posts, recent comments, a tag cloud or more.
© 2025 International Fluid Power, Inc. All Right Reserved.