Why Choose an AI Floor Cleaner for Your Business?
A commercial floor tells a story by midmorning: damp footprints near the entrance, crumbs beneath a café table, and dust along a warehouse aisle. An Ai Floor Cleaner can help teams handle routine cleaning across these changing spaces. Depending on its sensors and software, it may map routes, avoid obstacles, and report completed work. The result is not magic. It is a tool that can make daily cleaning more consistent.
AI researcher Andrew Ng famously said, “AI is the new electricity.” That idea helps explain the interest in smart cleaning equipment: AI can become useful when applied to a clear, repeated task. For facility managers, the practical question is whether an Ai Floor Cleaner fits the building, floor type, traffic patterns, and staffing plan. A polished demonstration alone is not enough. Ask about navigation in crowded areas, setup requirements, maintenance, and how performance is measured.
Small details matter. A narrow corridor, a glass wall, or a chair left outside its usual place can change a machine’s route. Teams should test the cleaner in real operating conditions and compare results over time. Check cleaning coverage, downtime, and the effort required from staff. Expectations need care. Automation may reduce repetitive passes, but it does not remove the need for oversight, maintenance, or human judgment. That gap deserves honest attention.
Defining AI Floor Cleaners: Autonomous Scrubbing, Sensing, and Navigation
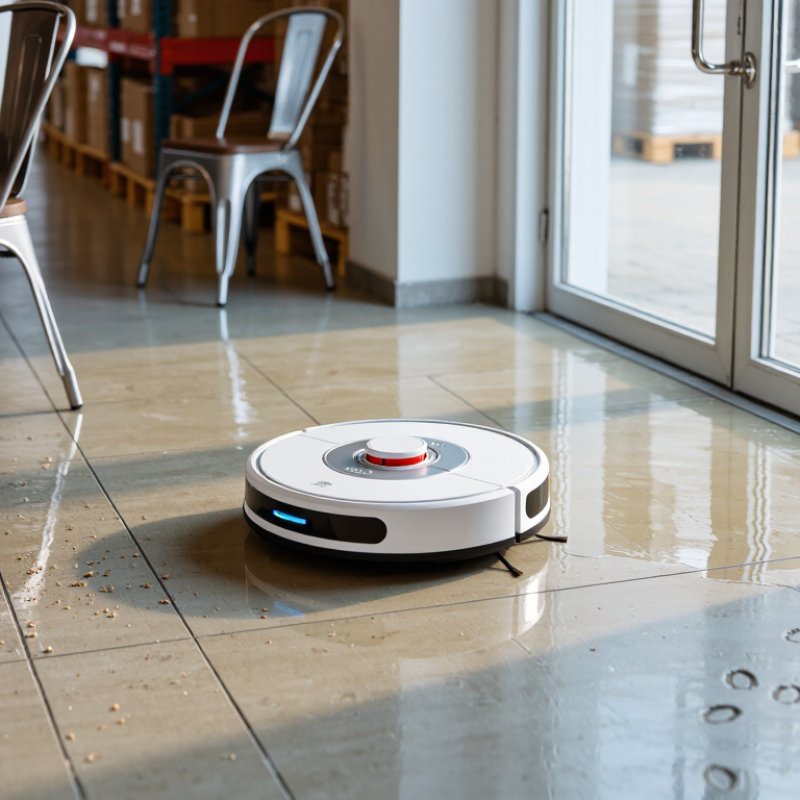
An AI floor cleaner combines three jobs: scrubbing, sensing, and navigation. It dispenses water and cleaning solution, rotates brushes, and recovers dirty water while moving across a programmed route. Sensors detect walls, furniture, people, and floor edges. Navigation software uses those signals to map a space, adjust its path, and avoid obstacles. The machine may pause when a chair blocks its route. It can also return to its charging point when its battery runs low. Not magic. Reliable operation still depends on sensible maps, regular maintenance, and staff who know how to respond to alerts.
The International Federation of Robotics’ World Robotics 2024 report recorded nearly 12,000 professional cleaning robots sold worldwide in 2023, a 4% increase from 2022. That figure shows growing adoption, not guaranteed savings for every facility. A supermarket, warehouse, and clinic each present different traffic patterns, debris, and floor finishes. In practice, operators should test route coverage, water use, obstacle handling, and cleaning results during busy periods. A polished map can become outdated after a layout change. That matters. AI can help a scrubber make consistent passes, but it cannot infer every human priority or spot every stubborn spill. Staff review remains part of the system, especially around wet floors and crowded aisles.
Why Choose an AI Floor Cleaner for Your Business?
AI floor cleaners combine autonomous scrubbing with sensing and navigation to clean commercial spaces. Planning begins with understanding the floor area.
Floor-area reference: Square-foot values are converted from the example areas using 1 m² = 10.7639 ft² and rounded to the nearest square foot. Actual cleaning coverage depends on the layout, obstacles, and cleaning settings.
Assessing Facility Fit Against BLS’s 2.4 Million U.S. Cleaner Jobs (2023)
Why Choose an AI Floor Cleaner for Your Business?
BLS figures cited in this assessment place U.S. cleaner employment at about 2.4 million jobs in 2023. That number shows the scale of cleaning work, but it does not prove that every facility faces a labor shortage. Nor does it tell managers how many hours are spent on floors. The practical question is narrower: how much of your team’s time goes to repeatable floor care? In a site visit, note the route, floor surface, busy periods, and obstacles such as chair legs or doorway mats. Details matter.
An AI floor cleaner may suit wide, predictable routes, such as corridors or open retail areas, where cleaning can happen without interrupting people. It may be a poor fit for crowded rooms, frequent spills, uneven transitions, or spaces that need close attention around equipment. Check run time, charging access, water handling, and who will clear the machine after an error. Then compare its coverage with actual cleaning logs, not optimistic estimates. The headcount figure is context, not a business case. A small pilot can reveal awkward gaps—sometimes the route looks simple on a map and isn’t. Keep staff involved; machines can cover routine passes, while people still handle inspection, edges, and changing conditions.
Comparing Automation Costs with BLS’s $35,930 Median Cleaner Wage (2023)
An AI floor cleaner is worth evaluating against labor hours it can genuinely replace, not a full-time worker on paper. The U.S. Bureau of Labor Statistics’ Occupational Employment and Wage Statistics reported a $35,930 median annual wage for janitors and building cleaners in May 2023. That is a national wage benchmark, not a local quote or a business’s complete staffing bill. Costs vary by location, shift, benefits, and building conditions.
Benefits matter. In its December 2023 Employer Costs for Employee Compensation release, the BLS reported that benefits represented 29.9% of private-industry total compensation. That figure covers workers broadly, so it is not a cleaner-specific markup. Compare a machine’s purchase or lease, service, consumables, and downtime with the paid cleaning hours it actually removes. Include supervision, too; a robot may need route checks around chair legs, wet thresholds, and crowded aisles. Payback can look neat in a spreadsheet and messy at 6 a.m. That gap deserves attention.
Tips: Track labor hours and floor area for four weeks before buying. Pilot one route, then record cleaning quality, stoppages, and staff time. Keep a human inspection; missed corners are easy to overlook.
Planning Safer Workflows Around OSHA Slip, Trip, and Fall Controls
Why Choose an AI Floor Cleaner for Your Business?
Planning Safer Workflows Around OSHA Slip, Trip, and Fall Controls
A floor-cleaning machine can support safer routines, but it cannot replace hazard controls or staff judgment. OSHA guidance emphasizes keeping walking surfaces clean, orderly, and free of hazards. Build cleaning into a site-specific plan: identify wet-entry areas, narrow aisles, floor transitions, and busy crossings before setting routes. A map helps. So does a walk-through during a typical shift.
Schedule scrubbing when foot traffic is low, and keep people away from damp sections until they are dry. Use visible warning signs or temporary barriers where needed; place them before cleaning starts, not after a spill occurs. An AI-guided cleaner may follow mapped routes and pause when it detects an obstacle. Staff should still check its path, especially around cords, loose packaging, and reflective floor patches. Sensors can miss things.
After a run, inspect the floor near drains and doorways, where moisture often lingers. Record recurring hazards, cleaning times, and any route interruptions. These notes can reveal that a doorway needs a mat, or that a route crosses a shift-change bottleneck. The machine may also need adjustment when shelves move or traffic patterns change. That part is easy to overlook. A short daily check keeps the workflow grounded in actual floor conditions, rather than relying on yesterday’s map.
Tracking Performance Through Coverage, Uptime, Water Use, and Cost per Square Foot
A floor cleaner earns its place through measured coverage, not a showroom speed claim. Record cleaned square feet per hour across real shifts, including chair legs, doorway turns, and refill stops. ISSA’s 612 Cleaning Times reference assigns production rates by cleaning task and equipment type. Use it as a planning baseline, then compare it with your own floor plan. The gap matters. An open aisle and a crowded cafeteria are not equivalent routes.
Track uptime as scheduled cleaning minutes minus downtime, divided by scheduled minutes. Log charging, water refills, blocked routes, and manual rescues separately; one uptime figure can hide the cause of missed areas. Water use should be measured per 1,000 square feet, alongside floor appearance and repeat passes. EPA WaterSense guidance estimates that commercial buildings can cut water use by 20% through water-efficient practices and equipment. That is a broad opportunity, not a guaranteed floor-cleaning result.
For cost per square foot, include labor, water, cleaning solution, maintenance, and equipment costs, then divide by verified cleaned area. A simple weekly log can expose uneven results: one wing may look efficient until extra passes are counted. Imperfect data is still useful, but inconsistent boundaries make comparisons misleading. Track the same zones and shift lengths before making a purchase decision.
Why Choose an AI Floor Cleaner for Your Business? — Tracking Performance Through Coverage, Uptime, Water Use, and Cost per Square Foot
| Performance Metric | Conventional Walk-Behind Scrubber | Autonomous AI Floor Cleaner | How to Interpret It |
| Nominal cleaning coverage | 20,000 sq ft per productive hour | 25,000 sq ft per productive hour | Estimated area cleaned during productive operation; actual results depend on layout, floor condition, obstacles, and cleaning settings. |
| Operational uptime | 85% | 90% | Share of scheduled operating time available for cleaning. Charging, refilling, maintenance, and interruptions reduce available time. |
| Effective coverage, including uptime | 17,000 sq ft per scheduled hour | 22,500 sq ft per scheduled hour | Nominal coverage multiplied by uptime; useful for estimating how much area can be cleaned within a scheduled shift. |
| Water use | 1.2 gal per 1,000 sq ft | 0.8 gal per 1,000 sq ft | Example operating assumptions. Actual consumption varies with floor type, soil level, solution settings, and water-recovery performance. |
| Direct labor assumption | $28 per scheduled operating hour | $8 per scheduled operating hour for oversight and intervention | Illustrative labor-cost inputs, not universal wage rates. Autonomous operation still requires monitoring, setup, and exception handling. |
| Labor cost per 1,000 sq ft | $1.65 | $0.36 | Calculated using the labor assumptions and effective coverage shown above. |
| Water and cleaning solution per 1,000 sq ft | $0.18 | $0.12 | Illustrative consumables cost, excluding unusual spills, heavy-soil conditions, or specialty chemicals. |
| Maintenance per 1,000 sq ft | $0.25 | $0.35 | Modeled allowance for routine service and wear items; actual costs depend on utilization and service arrangements. |
| Equipment cost per 1,000 sq ft | $0.20 | $0.55 | Illustrative allocation of purchase or lease cost over the equipment’s useful operating life. |
| Total modeled cost per 1,000 sq ft | $2.28 | $1.38 | Sum of the labor, water and solution, maintenance, and equipment cost assumptions listed above. |
| Modeled cost per sq ft | $0.00228 | $0.00138 | Calculated total cost per 1,000 sq ft divided by 1,000. Use site-specific costs before making purchasing decisions. |
Basis and limitations: This is an illustrative planning model, not a report of independently measured product performance. The figures are hypothetical but internally calculated from the assumptions shown. Replace them with verified site data—such as logged coverage, scheduled and available hours, metered water use, labor rates, service records, and equipment costs—when evaluating a facility.
